
When you are running software that is critical for your company you can't have logs just for analysing things that happened some time ago, having the client tell you that your application is broken while you didn't even know what was happening is a real problem. One of the ways to deal with that is using monitoring and logging.
Most applications will have logging, even if it is just a text file that will require the use of tools like grep or tail to see what's going on. But that's a very passive way to see the logs, as you have to take action, and probably you will only look at the logs when there's something wrong. What you need is to have your logs tell you what is happening, and today we are going to build the first step for that.
By the title you already probably know that we are going to talk about the Elasticstack. My intention with this post is to provide the basics way to start collecting and analysing your logs without you having to deal with all the hardships that I went through.
The Elastic Stack
Before known as ELK, the Elastic Stack is a set of tools that help you to collect, structure, store, analyse and also helps to create actions for certain situations.
The Elastic Stack is composed of 4 components:
Kibanais the visualisation tool that reads data fromElasticSearch. You can create dashboards or make queries toElasticSearchmanually.ElasticSearchis the store for the logs. You can send logs fromBeatsorLogstashand it's stored in an index. You can have multiple indexes to store data from multiple sources.Logstashis the app that takes care of the logs, you can parse the logs into more useful data and send it toElasticSearch.BeatsorFilebeatis a lightweight tool that reads the logs and sends them toElasticSearchorLogstash. The only purpose of this tool is to read the log files, it can't do any complex operation with it. If you need to do a complex operation then you can send that log toLogstashfor it to parse it into the desired information.
Logstash
We are starting with Logstash since it's how you collect and parse your logs (Yes, I mentioned Beats but you don't need that to start).
Logstash is a log processor and retriever. The main feature of Logstash is to give structure to unstructured log files, there are three steps for processing a log:
- Input - Receiving or Fetching the log.
- Filter - Processing or filtering.
- Output - Sending the log to a permanent store.
Input
Logstash can retrieve data not only from log files, but it can get data from multiple sources like:
- Text files
- Databases
- Shell commands
- Queues
- Http Requests
If you want to see all the input plugins that Logstash supports check the docs.
Right now, the inputs that I've been using and I will explain how to use are:
- Text files
- Databases
- Shell commands
Text File Input
One of the most common ways to store logs is in text files that sit somewhere in the machine, usually /var/log. Logstash has a plugin that reads the file and keeps watching for new lines just like tail -f.
To use the plugin it's very straightforward, you just have to add the path of the file and Logstash will take care of the rest, don't worry about rotating the files, the plugin knows how to deal with that too.
The usage of the file plugin is like this:
input {
  file {
    path => /var/log/app/realworld.log
    id => realworld
  }
}
In the way that we configured Logstash above, every line will be a log entry. But sometimes our logs are not that simple and we have things like Stack traces or we write JSON into the logs. In this case we need them to be together to make sense and that's why Logstash provides codecs, which are a way to extend the input plugins. One of those codecs is Multiline.
For example, below we have the logs for an application that uses Spring and when we have a Stack Trace we want to group it just in one line.
2019-08-18 18:31:53.845 INFO 6724 --- [ main] o.s.t.web.servlet.TestDispatcherServlet : FrameworkServlet '': initialization completed in 17 ms
com.andre2w.transaction.TransactionTooOldException
  at com.andre2w.transaction.TransactionService.validateTimestamp(TransactionService.java:46)
  at com.andre2w.transaction.TransactionService.add(TransactionService.java:29)
  at com.andre2w.controllers.TransactionController.create(TransactionController.java:42)
  at sun.reflect.NativeMethodAccessorImpl.invoke0(Native Method)
  at sun.reflect.NativeMethodAccessorImpl.invoke(NativeMethodAccessorImpl.java:62)
  at sun.reflect.DelegatingMethodAccessorImpl.invoke(DelegatingMethodAccessorImpl.java:43)
  at java.lang.reflect.Method.invoke(Method.java:498)
2019-08-18 18:31:53.891 INFO 6724 --- [ main] o.s.b.t.m.w.SpringBootMockServletContext : Initializing Spring FrameworkServlet ''
2019-08-18 18:31:53.892 INFO 6724 --- [ main] o.s.t.web.servlet.TestDispatcherServlet : FrameworkServlet '': initialization started
So if we want to capture the Stack Trace from our logs we can do a simple regex to group everything starting with space.
input {
  file {
    path => /var/log/app/realworld.log
    id => realworld
    codec => multiline {
      pattern => "^\s"
      what => "previous"
    }
  }
}
But in this case we can go even further. As these logs are from an application using Spring and all the logs they follow a certain format, we can group everything that doesn't match that format which will include stack traces, JSON and objects.
input {
  file {
    path => /var/log/app/realworld.log
    id => realworld

    codec => multiline {
      pattern => "\d{4}-\d{2}-\d{2} \d{2}:\d{2}:\d{2}\.\d{3} \w+ \d+ --- \[\s+\w+]"
      negate => true
      what => "next"
    }
  }
}
What does negate and what mean?
Negate is the option to define if you want to group lines where the regex does or doesn't match. In the first example the field negate is omitted, so it has the default value False. negate => false means that lines will be grouped together when the regex IS matched. negate => true means that lines will be grouped together when the regex IS NOT matched.
The what is how Logstash will group the requests. previous means that the matched line will group with the previous line and next it's pretty much obvious what it does.
Database
Since Logstash is running using Java, you have access to any database supported by JDBC. For Postgres, you can see the number of locks querying the table pg_locks.
The configuration for something like that would be:
input {
  jdbc {
    jdbc_connection_string => "jdbc:postgres://localhost:5432/main"
    jdbc_user => "postgres"
    jdbc_password => "postgres"
    jdbc_driver_class => "org.postgresql.Driver"
    statement_filepath => "/etc/logstash/queries/query-locks.sql"
    schedule => "* * * * *"
    tags => ["jdbc","staging-1","query-locks", "main"]
  }
}
The fields starting jdbc_ hold the information to connect to the database. Then we have statement_filepath, this points to the file with the query that you want Logstash to run, you can also use the statement option for more ad-hoc queries. Finally, we have the schedule option, this is the frequency that you want to run the query, the value is based on the Linux crontab, in this example it would be running every minute.
tags help you to identify the query that you are running. It's just an array of strings, you can add anything.
Logstash will parse all the fields and send it to the datastore defined in the output.
Something to keep an eye on when using the JDBC input is that you need the jar in the Logstash classpath. In the Logstash install folder, you go to libs/jars and add the jar for the database driver.
Exec
Sometimes you might want to get a piece of data from a source that Logstash doesn't support very well. In this case you can use the exec input plugin that executes a command-line application and gets the result as the logline.
input {
  exec {
    command => "/usr/bin/retrieve-data.sh"
    schedule => "* * * * *"
    tags => ["retrieve-data","staging"]
  }
}
This input is very straightforward to use, you have the options:
command: The shell command that you want to use.schedule: Same as thejdbc-inputschedule is the frequency you want to run the command.tags: Information to identify the result later.
With this plugin you don't have to worry about the result being multi-lined, Logstash will group everything in one line.
Filter
Lets say we are receiving data from all the inputs, but we need to transform that data in something useful. We don't just want to have log lines but we want statistics to be able to see what is happening in real-time and transform the logs that we receive into properly structured data.
Grok Parser
In most cases the Grok Parser plugin is used. Most of the time the data from the logs is not in a structured format but we still need to parse this unstructured data and give some meaning to it. We can't have numbers being strings if we want to sum something. Grok doesn't structure the data by using regexes, Logstash has a set of built-in regexes that cover most cases.
Here's an example of a filter.
We are receiving HTTP requests from the internet and we want to track which endpoints have the most requests, our log is structured in this following way:
192.168.0.1 GET /index
So we add a Grok filter to structure that:
filter {
  grok {
    match => {
      "message" => "%{IP:client} %{WORD:method} %{URIPATHPARAM:request}"
    }
  }
}
What is happening in that filter?
match is saying to check the message field of the logs that we receive and transform them into structured data.
So we have the request from the webserver:
I want Logstash to get the log and transform it into structured data (it's a JSON, like everything nowadays). We make the matcher like:
"%{IP:client} %{WORD:method} %{URIPATHPARAM:request}"
The syntax for grok is %{PATTERN:field}
The pattern is how you want to match the field and what kind of regex will be used in the data and the field will be the field where that data is going to be stored (bit obvious). You can see all the patterns available here.
In the case that Logstash is unable to parse the pattern properly, it will add a tag called _grokparsefailure.
Since it's just a bunch of regexes parsing data you can create your own patterns. For that, you need to create a folder named patterns inside the Logstash folder (you will need to check where is installed). The filename can be named anything you want, Logstash will read everything inside.
grok {
  match => {
    "path" => "/%{FILE_VERSION:version}_%{BU_ID:id}\.csv$"
  }
  patterns_dir => ["/elasticsearch/logstash/example/patterns"]
}
There's also a way of having the files in a different folder and then declare this in the config file.
The contents of the file have to follow the pattern of PATTERN_NAME regex, so you would end with something like:
FILE_VERSION \w+\d{6}(?=_)
BU_ID \d{3}(?=\.)
If you are not planning to reuse the regex and want to inline it, you can do that too:
%{DATESTAMP:timestamp} (?<mti_before>\w{46})(?<mti>\w{4})%{GREEDYDATA}
Like a regex group you use parenthesis to specify what you want to group, then you start with a question mark to inform that you are going to use a regex. Then you add the name of the field that you are going to parse the data to and finally, you can add the regex.
Grok will also allow conversions to int and float. You just have to add as an extra parameter in the match. E.g.: %{IP:client:int}
When using the grok plugin take care to not duplicate the message that you are sending by adding the pattern:
grok {
  match { message => "%{GREEDYDATA:message}" }
}
This would add a new message to the message field instead of replacing.
JSON
You might be in a better situation and have structured your logs in a format like JSON. For that Logstash will give you free parsing.
json {
  source => "message"
  target => "payload"
}
That's everything you have to do for Logstash to parse all the JSON messages and set the proper data type for the fields.
Key-Value
Another filter that might be useful is Key-Value or kv. It is used to split data based on two keys. So if we have a logline that looks like:
timestamp=10/09/2019 10:10:50, level=INFO, message=Something wrong might not be right
We can use the kv filter like this:
filter {
  kv {
    source => "message"
    field_split => ","
    value_split => "="
    target => "summary"
  }
}
So we can parse the data from the message using the kv filter. The only problem with this filter is that you can't set the data type during the filter step.
Mutate
You might want to change the log that you are receiving, I'm not talking about full parsing of a logline but small changes. There's the mutate filter to do that and there are multiple commands that can be used to change your log.
Some examples of what you can do with the mutate filter:
convert: You might have parsed a field but you need that field to be more than just a string. Theconvertcommand allows you to convert tointeger,float,string, orboolean.
filter {
  mutate {
    convert => {
      "quantity" => "integer"
      "is_paid" => "boolean"
    }
  }
}
remove_field: You might want to drop some sensitive data from your logs, so you can use this command to remove it.
filter {
  mutate {
    remove_field => ["sensitive_data"]
  }
}
gsub: This is an option to replace values using a regex, you might want to obfuscate some data that isn't relevant, you can use this option for that.
filter {
  mutate {
    gsub => [
      # field regex result
      "transaction_reference", "\d{4}-\d{4}-\d{4}-\d{4}", "XXXX-XXXX-XXXX-XXXX"
    ]
  }
}
This will replace all transaction references with a masked version.
Output
This is the part where you can direct the log that you just parsed to an output or datastore. In our case we are going to use Elasticsearch which is a NoSQL document store, but you can also send to other places like CSV, HTTP or even email.
You can check the documentation for Logstash to see all the output plugins.
output {
  elasticsearch {
    hosts => ["192.168.0.15"]
    user => "elastic_user"
    password => "elastic_password"
    index => "application-log"
  }
}
In the example here we are sending our logs to Elasticsearch hosted in another machine.
Elasticsearch
Elasticsearch is a search analytics engine that does the job of collecting and aggregating the stored data. It also provides a real-time search for all kinds of data be that structured or unstructured text, or numerical data.
All the data in Elasticsearch is stored in the JSON format and then indexed which enables you to immediately search it. Each stored document is a collection of key-value pairs that contain the data and it's stored in an optimised data structure that helps searching it later.
Basic constructs
Nodes
Nodes are one of the most basic constructs that stores and indexes the data. There are multiple types of node.
- Master node: This controls the cluster
- Data node: This holds the data and performs CRUD operations, aggregations and searches.
- Ingest node: This transforms and enriches the data before indexing.
Index
An index is a collection of documents with similar characteristics, they are like tables in a relational database.
The Indexes are more flexible than a relational database, since they are lightweight you can create multiple indexes without much difficulty. In logging for example, you can create an index for each day and have the type to be the kind of log that you have.
Every day a new index will be created, you wouldn't do that for a relational DB.
Using Elasticsearch
There are two main things that we have to pay attention to when working with Elasticsearch. They are templates and policies.
Templates
Templates could be considered the schema of your index, Elasticsearch can set a default schema, but you need more control of it if you want do make aggregations and calculations in the data that you have.
Which types does Elasticsearch support? The main data types supported are:
- String
- Numeric (long, int, short, double, float)
- Date
Building templates
How do I set up my template? Well, Elasticsearch has a REST-like API that you can easily interact with.
We are adding logs for an application for a Fintech company and we want to monitor the funds transfers that we are making. The payload that we have for transfers is:
{
  "paymentDate": "2019-09-14 11:25:32.321",
  "amount": 100.00,
  "message": "Payment message",
  "origin": {
    "sortCode": "11-11-11",
    "account": "838383"
  },
  "destination": {
    "sortCode": "11-11-11",
    "account": "1313123"
  }
}
We start building our template with the payment_date field and we can set the type as date and give the format for the field:
"payment_date": {
  "type": "date",
  "format": "yyyy-MM-dd HH:mm:ss.SSS"
}
Then we have the amount, we add this field with the type scaled_float and the scaling_factor to be 100 so Elasticsearch can handle two digits in the decimal part making life a little easier for our searches later:
"amount": {
  "type": "scaled_float",
  "scaling_factor": "100"
}
Then we have the field message which is just a string, so we are going to use the text type which creates a field that is indexed for full text search:
"message": {
  "type": "text"
}
The origin and destination fields are virtually the same and they always have the same format, so we can use the keyword type. This type is good for small amounts of semi-structured data like postal code, addresses, emails, sort codes and account numbers:
"origin": {
  "properties": {
    "body": {
      "properties": {
        "sort_code": {
          "type": "keyword"
        },
        "account": {
          "type": "keyword"
        }
      }
    }
  }
}
Now we have the full mapping for the index we can insert that to Elasticsearch. We just make a PUT request to it.
curl -X PUT "http://elasticsearch.com/_template/transfers_template" -d @transfers_template.json
{
  "index_patterns": [
    "transfers-*"
  ],
  "mappings": {
    "_meta": {
      "beat": "transfers",
      "version": "7.0.1"
    },
    "date_detection": false,
    "dynamic_templates": [
      {
        "labels": {
          "mapping": {
            "type": "keyword"
          },
          "match_mapping_type": "string",
          "path_match": "labels.*"
        }
      },
      {
        "container.labels": {
          "mapping": {
            "type": "keyword"
          },
          "match_mapping_type": "string",
          "path_match": "container.labels.*"
        }
      },
      {
        "fields": {
          "mapping": {
            "type": "keyword"
          },
          "match_mapping_type": "string",
          "path_match": "fields.*"
        }
      },
      {
        "docker.container.labels": {
          "mapping": {
            "type": "keyword"
          },
          "match_mapping_type": "string",
          "path_match": "docker.container.labels.*"
        }
      },
      {
        "kibana.log.meta": {
          "mapping": {
            "type": "keyword"
          },
          "match_mapping_type": "string",
          "path_match": "kibana.log.meta.*"
        }
      },
      {
        "strings_as_keyword": {
          "mapping": {
            "ignore_above": 1024,
            "type": "keyword"
          },
          "match_mapping_type": "string"
        }
      }
    ],
    "properties": {
      "@timestamp": {
        "type": "date"
      },
      "payment_date": {
        "type": "date",
        "format": "yyyy-MM-ddTHH:mm:ss.SSSSSS"
      },
      "amount": {
        "type": "scaled_float",
        "scaling_factor": "100"
      },
      "message": {
        "type": "text"
      },
      "origin": {
        "properties": {
          "body": {
            "properties": {
              "sort_code": {
                "type": "keyword"
              },
              "account": {
                "type": "keyword"
              }
            }
          }
        }
      },
      "destination": {
        "properties": {
          "body": {
            "properties": {
              "sort_code": {
                "type": "keyword"
              },
              "account": {
                "type": "keyword"
              }
            }
          }
        }
      }
    }
  }
}
Policies
This feature is only available in the premium versions of Elasticsearch.
The indexes are going to be bombarded with data the entire time and just like log files, we need a rollover policy to not get our disks full. In the premium version of Elasticsearch, we have the Index Policies tools to help us manage that.
The first thing to know is what are the states that an Index can be.
hot: Is the index that we are writing in.warm: Is an index that we are querying frequently, but not writing in.cold: Is an index that we don't write to anymore and we also don't query the data very often.delete: Is an index that is no longer needed and can be deleted.
An index starts at the hot state and we can say to Elasticsearch when we don't want to keep writing in an index anymore. We tell it to start to use another index using the max_age and the max_size options. In the example below, we are making a new index every day or when it reaches 5GB (the number was arbitrarily chosen).
{
  "policy": {
    "phases": {
      "hot": {
        "actions": {
          "rollover": {
            "max_age": "1d",
            "max_size": "5GB"
          }
        }
      }
    }
  }
}
We don't want to keep all the indexes hot, so we can start to change the state of our older indexes and make them warm. The policy to define what is going to the warm state starts with the min_age parameter, which sounds very obvious what it does. In our case we are setting the min_age to 7d, so all the hot indexes that are seven days or older are going to be converted to a warm index.
For warm indexes we have some options that weren't previously available in the hot one, the actions section allows us to do some changes when changing the state of the index.
The first one that we can see is forcemerge this option, when set to 1, tells Elasticsearch to merge all the indexes that are going from hot to warm. This is helpful because in Elastisearch when you delete a document, that document isn't really deleted, but only marked has deleted. During the merge the documents marked as deleted are going to be properly deleted, like you would send the files to the Trash bin and then delete them from your system later.
Then we have shrink which is used to reduce the number of shards of an index. Since we are not writing in that index anymore we don't need all shards that we allocated previously.
And finally we have allocate. Here we can set the number_of_replicas, in case we need the data to be highly available, also it's more secure than having only one shard.
"warm": {
  "min_age": "7d",
  "actions": {
    "forcemerge": {
      "max_num_segments": 1
    },
    "shrink": {
      "number_of_shards": 1
    },
    "allocate": {
      "number_of_replicas": 2,
      "require": {
        "data": "warm"
      }
    }
  }
}
For data that is even older than what we set for the warm state and that we are just storing for security reasons, we can turn their indexes to cold. We set to every index older than 6 months to be set to cold and we freeze them. The advantage of having the freeze in this step is that Elastisearch don't use extra memory for frozen indexes.
"cold": {
  "min_age": "180d",
  "actions": {
    "freeze": {}
  }
}
Finally, there is the deletion of the index that is quite straight forward.
"delete": {
  "min_age": "365d",
  "actions": {
    "delete": {}
  }
}
The final policy that we have would look like this:
{
  "policy": {
    "phases": {
      "hot": {
        "actions": {
          "rollover": {
            "max_age": "1d",
            "max_size": "5GB"
          }
        }
      },
      "warm": {
        "min_age": "7d",
        "actions": {
          "forcemerge": {
            "max_num_segments": 1
          },
          "shrink": {
            "number_of_shards": 1
          },
          "allocate": {
            "number_of_replicas": 2,
            "require": {
              "data": "warm"
            }
          }
        }
      },
      "cold": {
        "min_age": "100d",
        "actions": {
          "freeze": {}
        }
      },
      "delete": {
        "min_age": "365d",
        "actions": {
          "delete": {}
        }
      }
    }
  }
}
Beats
FileBeat
Filebeat is a lightweight tool that reads the logs and sends them to ElasticSearch or Logstash. The only purpose of this tool is to read the log files, it can't do any complex operation with it. If you want to perform complex operations then you can send the log to Logstash and parse into the desired information.
When you have multiple servers and you don't want to install Logstash in all the machines because it's a heavy application, you can use Filebeat as it's written in Go, is natively compiled and it's very lightweight.
It's not too hard to configure Filebeat since it doesn't do much. You have the filebeat.yml that contains the configuration:
filebeat.config.inputs:
 filebeat:
 inputs:
  - type: log
 paths:
  - "/var/log/applog/*.log"

 output:
 logstash:
 hosts: ["logstash:5043"]
We can see the inputs part that reads the logs from a folder and sends to an output in Logstash that is hosted elsewhere. In this configuration file, we are reading logs from the folder applog. You can also use the glob patterns in the paths to get multiple files or to capture differences like upper or lower case letters.
Multiline string
When working with Filebeat you might need to read multiline strings. Just like Logstash you can use the multiline options in the configuration to read the file, all the same fields for Logstash are applied for Filebeat.
filebeat.config.inputs:
  - type: log
    paths:
      - "/var/log/applog/application.log"
    multiline:
      pattern: "\\[\\d{2}\\/\\d{2}\\/\\d{4} \\d{2}:\\d{2}:\\d{2}]\\[\\w{2}\\]"
      negate: True
      match: after
How Filebeat works | Filebeat Reference [7.1] | Elastic
Fields
You can also add extra information to the logs that you are reading so you can identify the files that the data has been obtained from for use at a later date.
filebeat.config.inputs:
  - type: log
    paths:
      - "/var/log/applog/application.log"
    fields:
      file_name: "application_log"
    multiline:
      pattern: "\\[\\d{2}\\/\\d{2}\\/\\d{4} \\d{2}:\\d{2}:\\d{2}]\\[\\w{2}\\]"
      negate: True
      match: after
Autoreload
You can also split the input list from the configuration file and by doing that you can update the file with the inputs without restarting Filebeat. So instead of adding the inputs straight away in the main config file we provide the to the file with the inputs configuration.
filebeat.config.inputs:
  enabled: true
  path: inputs.yml
  reload.enabled: true
  reload.period: 10s
The inputs.yml that Filebeat is going to load:
- type: log
  paths:
    - "/var/log/haproxy.log"
  fields:
    file_name: "Haproxy"
Kibana
Up to this point we are collecting, structuring and storing all those logs. Now we need to get some value from them. Just having them stored isn't the best option, we need to visualise them to have some feedback.
For visualising all the data that was stored to Elasticsearch you can use Kibana. It's an application that allows you to query the data from Elasticsearch and create visualisations based on that.
In the Kibana home we opted to connect to an Index in Elastisearch using a pattern to specify the name of the index like logs-* so we can search all indexes starting with logs- since we might have grouped our logs by day and not with everything in one index.
Discovery
The Discovery area allows you to visualise and search data stored in Elastichsearch.
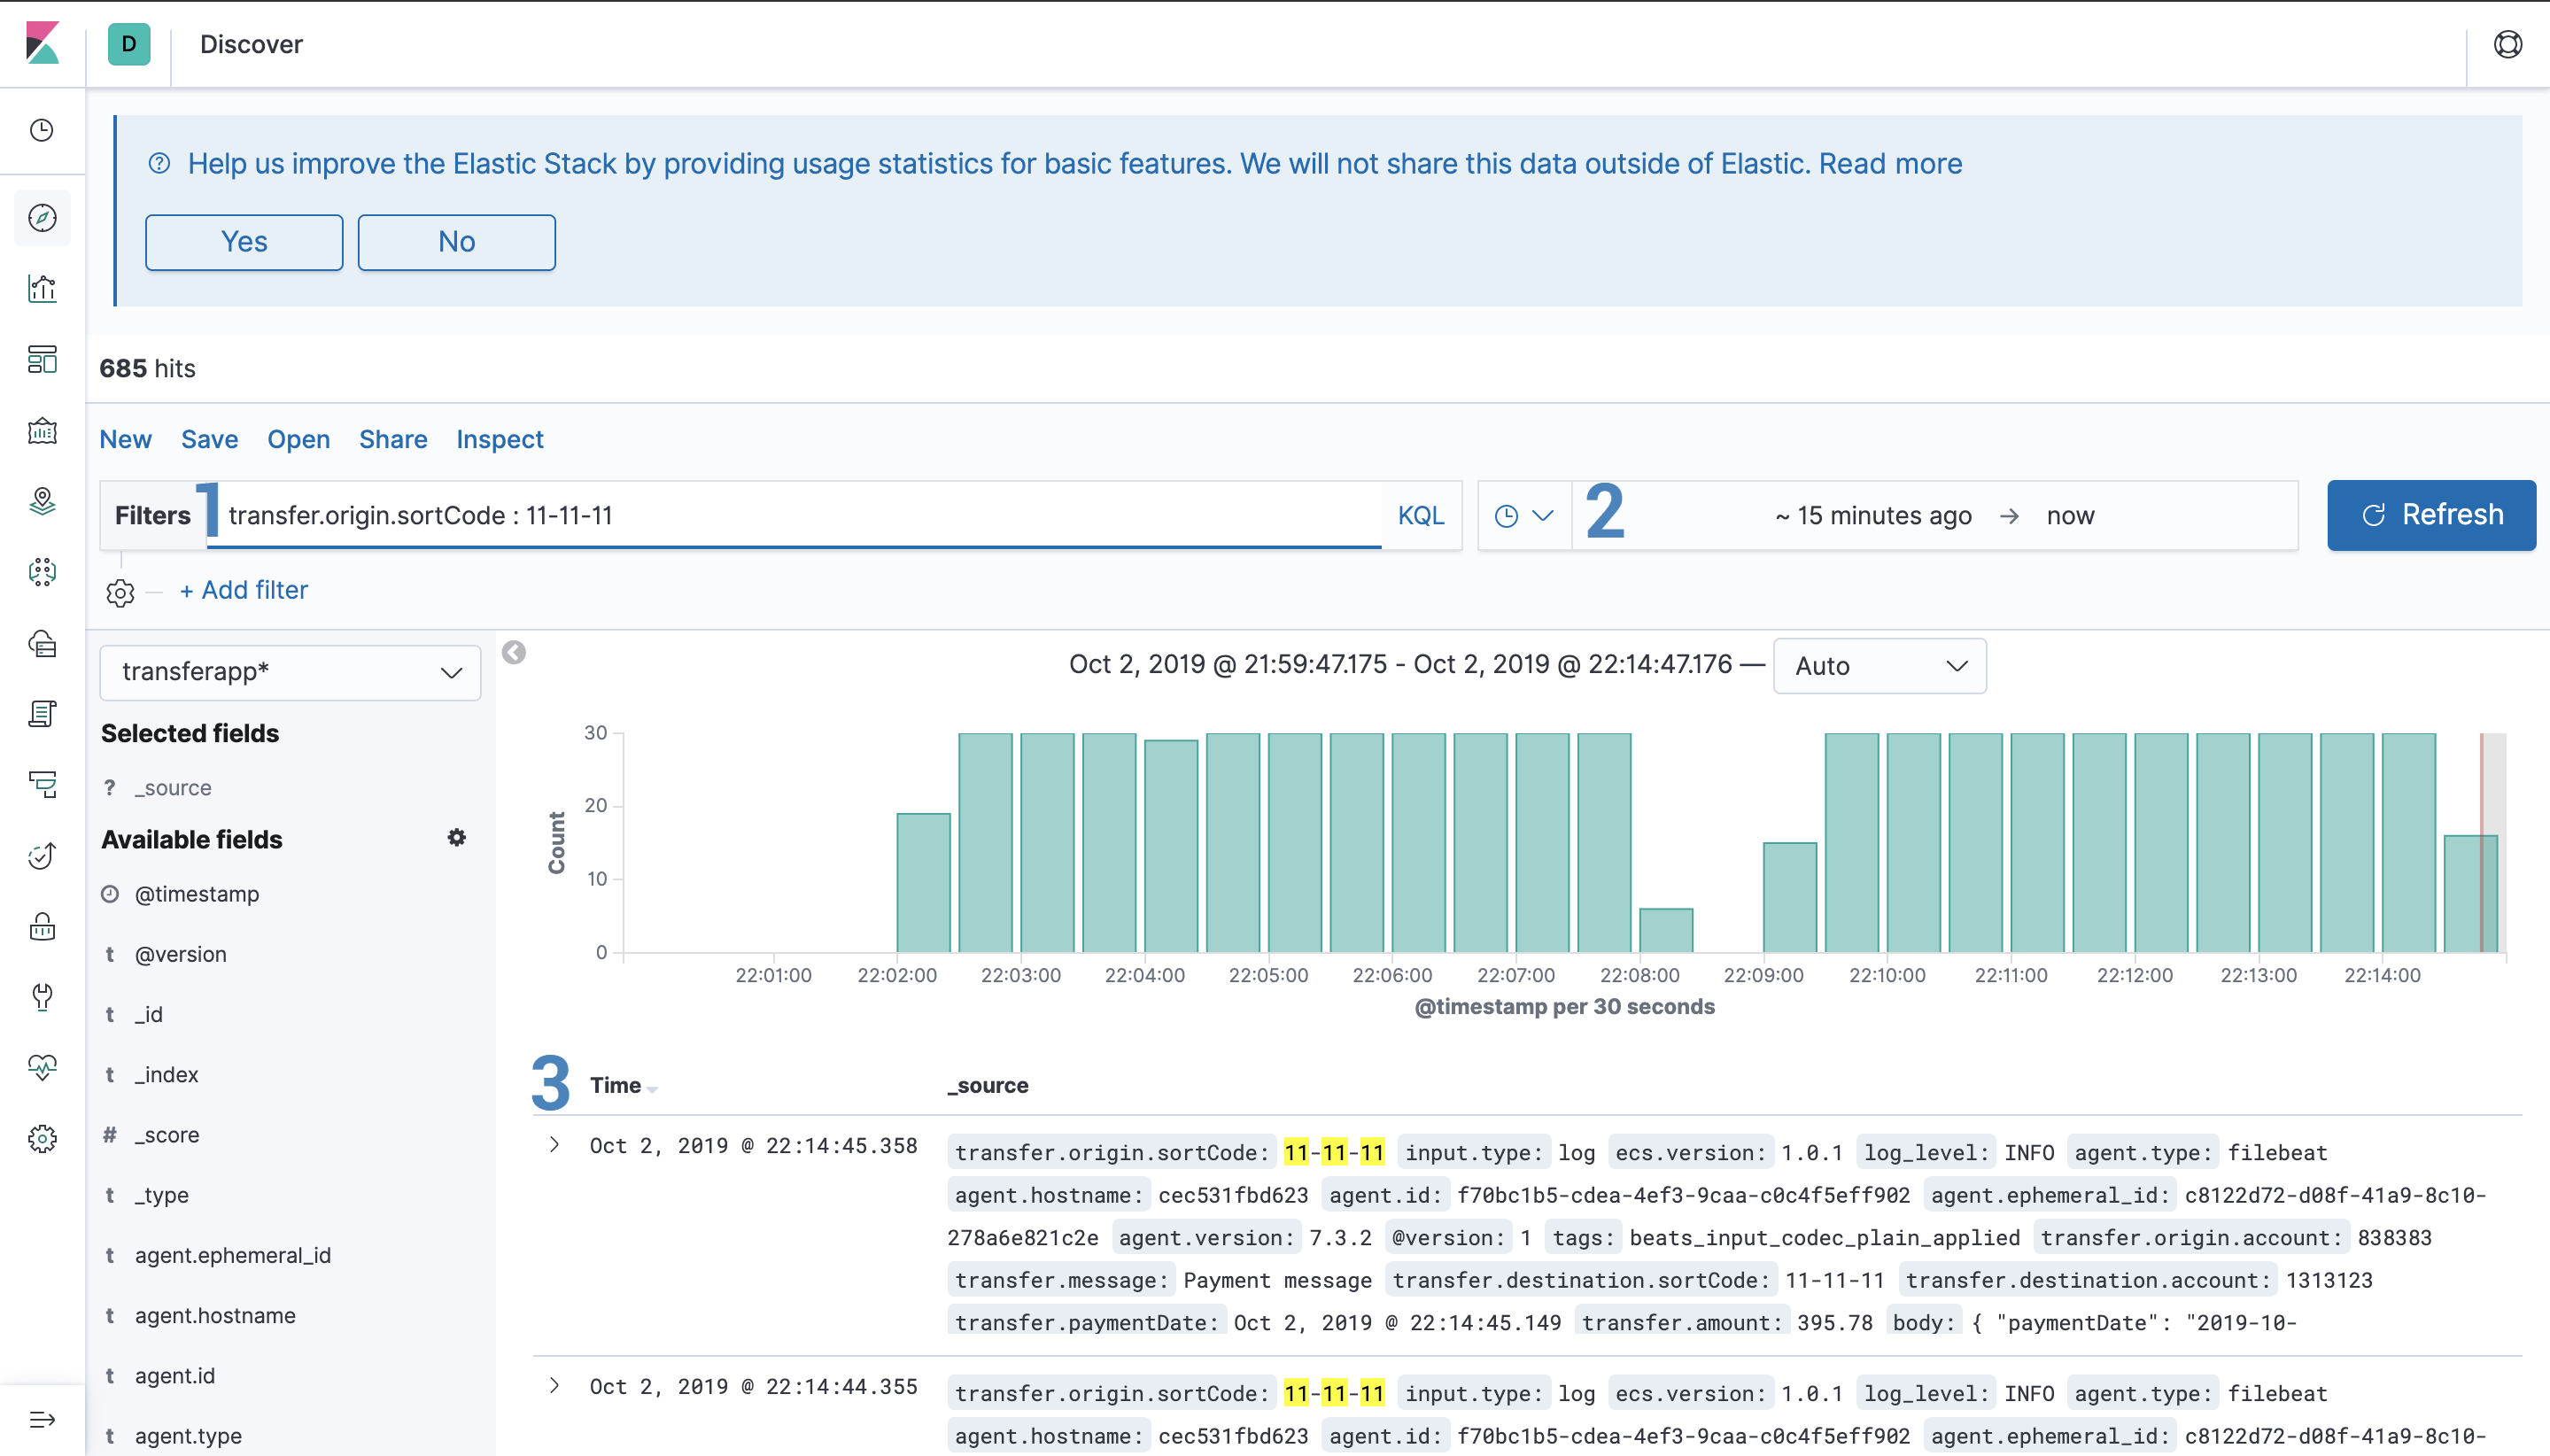
1 - Filters
You have a bar where you can write your queries using KQL which is a custom query language that is quite easy to use. Kibana will help you to auto-complete the query too.
So if we want to search you can just type:
tags: "retrieve-data" and stats1 >= 10000
Or you can use the filters section where you have a more UI oriented way to make your searches.
You can also save your searches for later so you don't have to rewrite every time. The saved searches can be used in other parts of the Kibana UI.
2 - Date filters
In case you want to filter the results by a specific period, the filter allows you to use two options:
- Absolute: You can set the exact date and time that you want.
- Relative: You set a date and a timestamp that you want, like
10 minutes ago. With this option, you can also set to get the latest data fromElasticsearch.
3 - Records
You can expand and see records in a key-value way and it also shows the type of the field, which can be three:
t- Text field#- Numeric field- Clock Symbol - Date time
You can also filter which fields you want to see by selecting them in the Available Fields menu on the left
Visualise
We need a way to visualise all that data that is stored nicely, and Visualise allows us to create multiple kinds of graphs.
Y-Axis
In this example we are creating a bar graph. In the left menu you can set the options to create a graph.
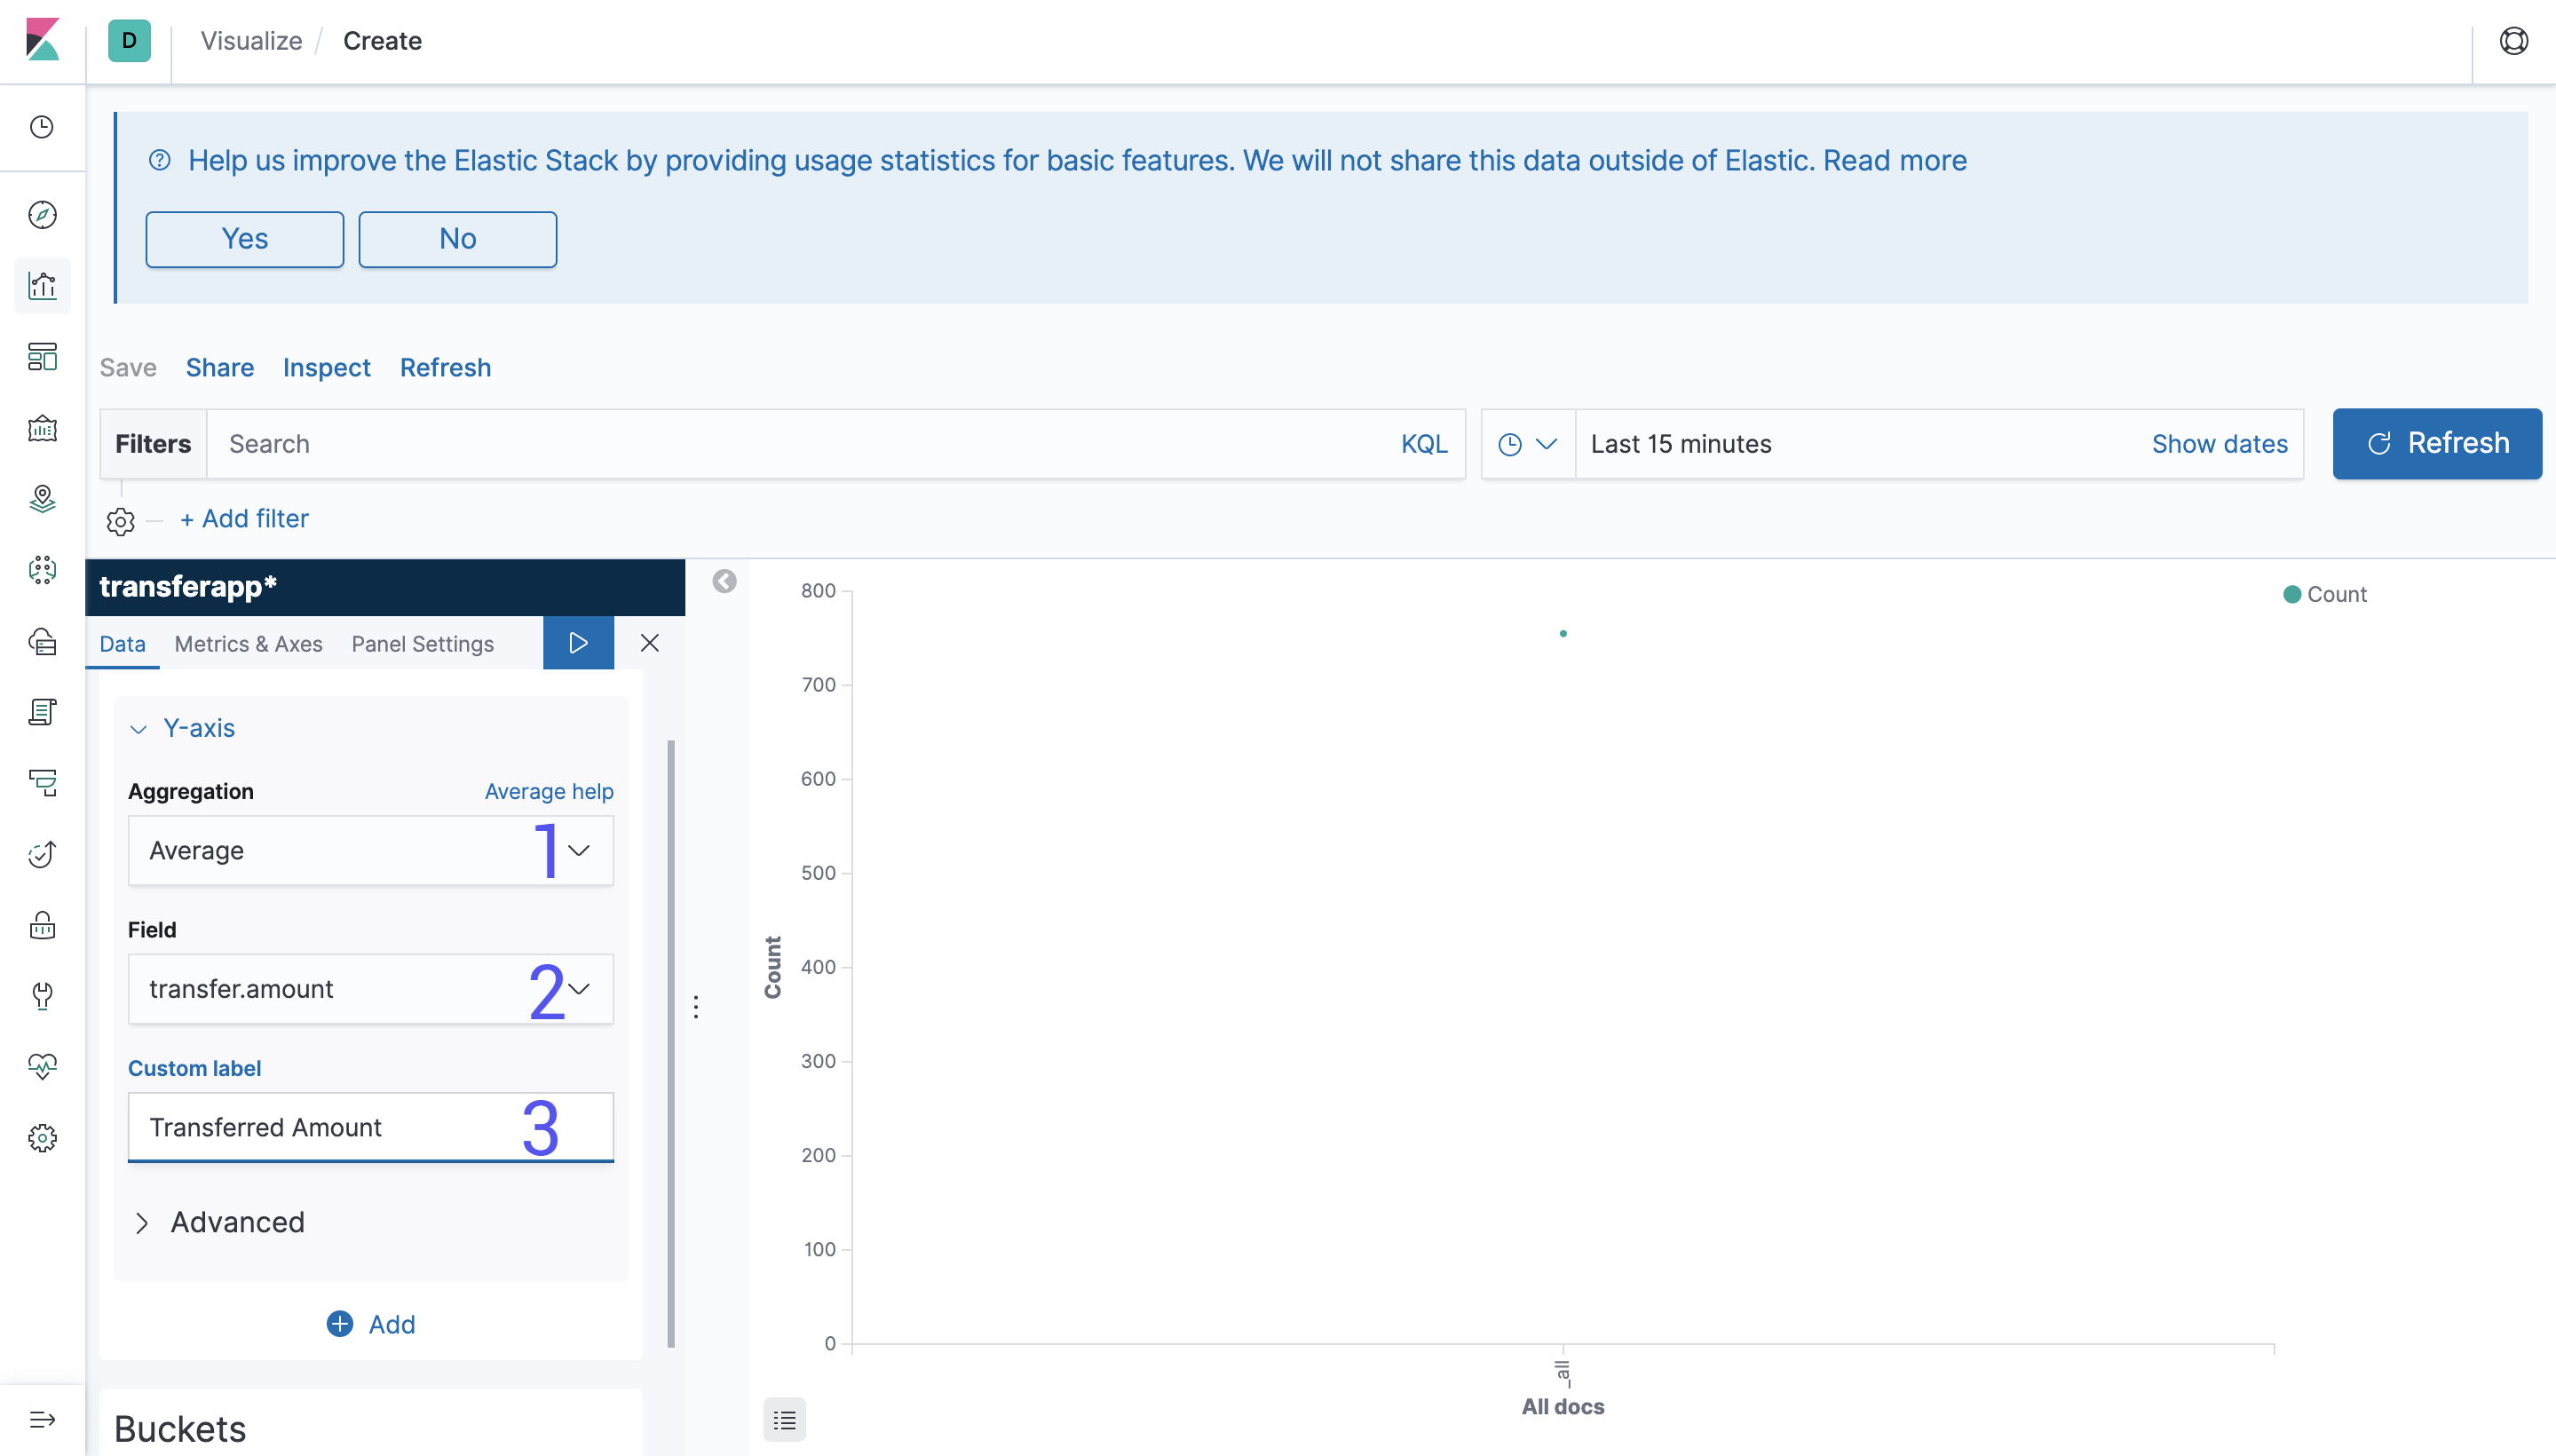
Aggregation: Is the kind of operation that you want to perform, which can be operationscount,sumandaverage. There are also more complex operations likeStandard Deviationand operations using other values.Field: Is the field that you want to use to make the calculation and the value to be displayed. For simple aggregations you can select the field straightway from the dropdown and for more complex queries you can useQueryDSLandJSONto find the values.Custom Label: You probably don't want to display your data without meaning, so here you can add a nice label for it.
Buckets
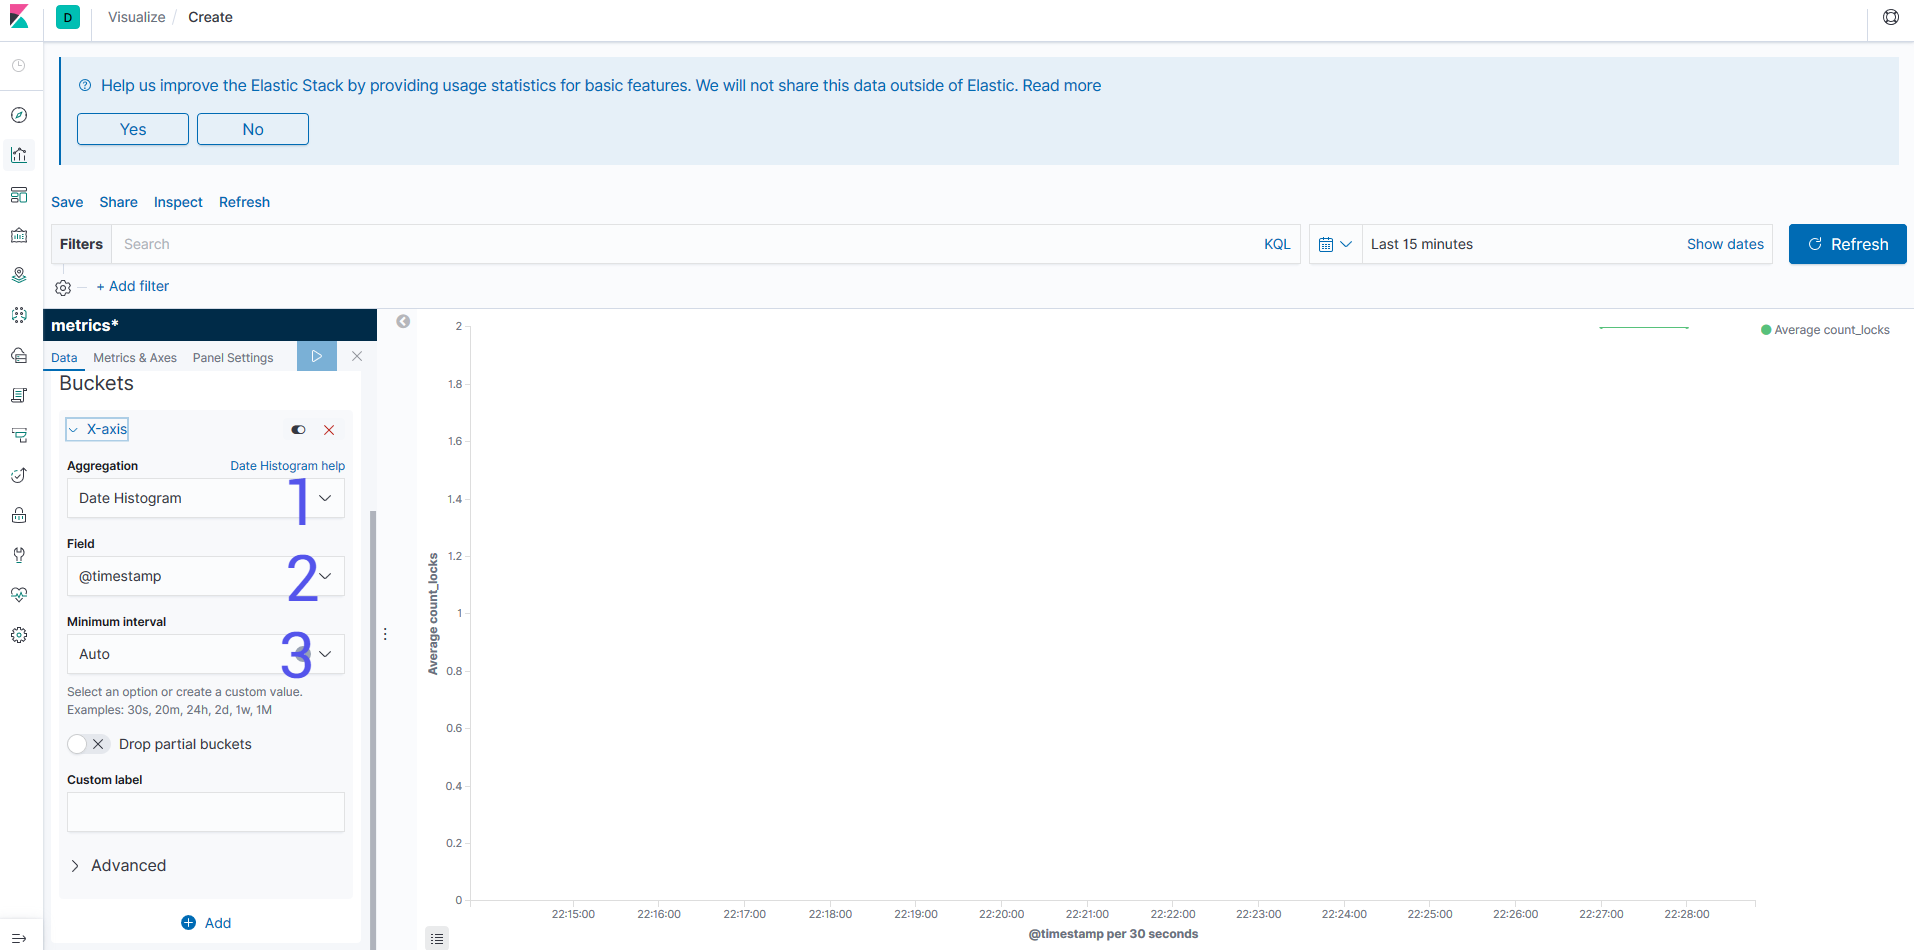
Aggregation: Is how your are going to group your data. You might want a time using theDate Histogramor something to group the endpoints that you have using a specific field.Field: Is the field that you are going to use to split the data. In case you need a more complex aggregation, you will be able to use theQueryDSLas an input.Interval: In case you want to group by the date you can specify the time period that you want to split the data. For other aggregations like ranges you get different interval fields.
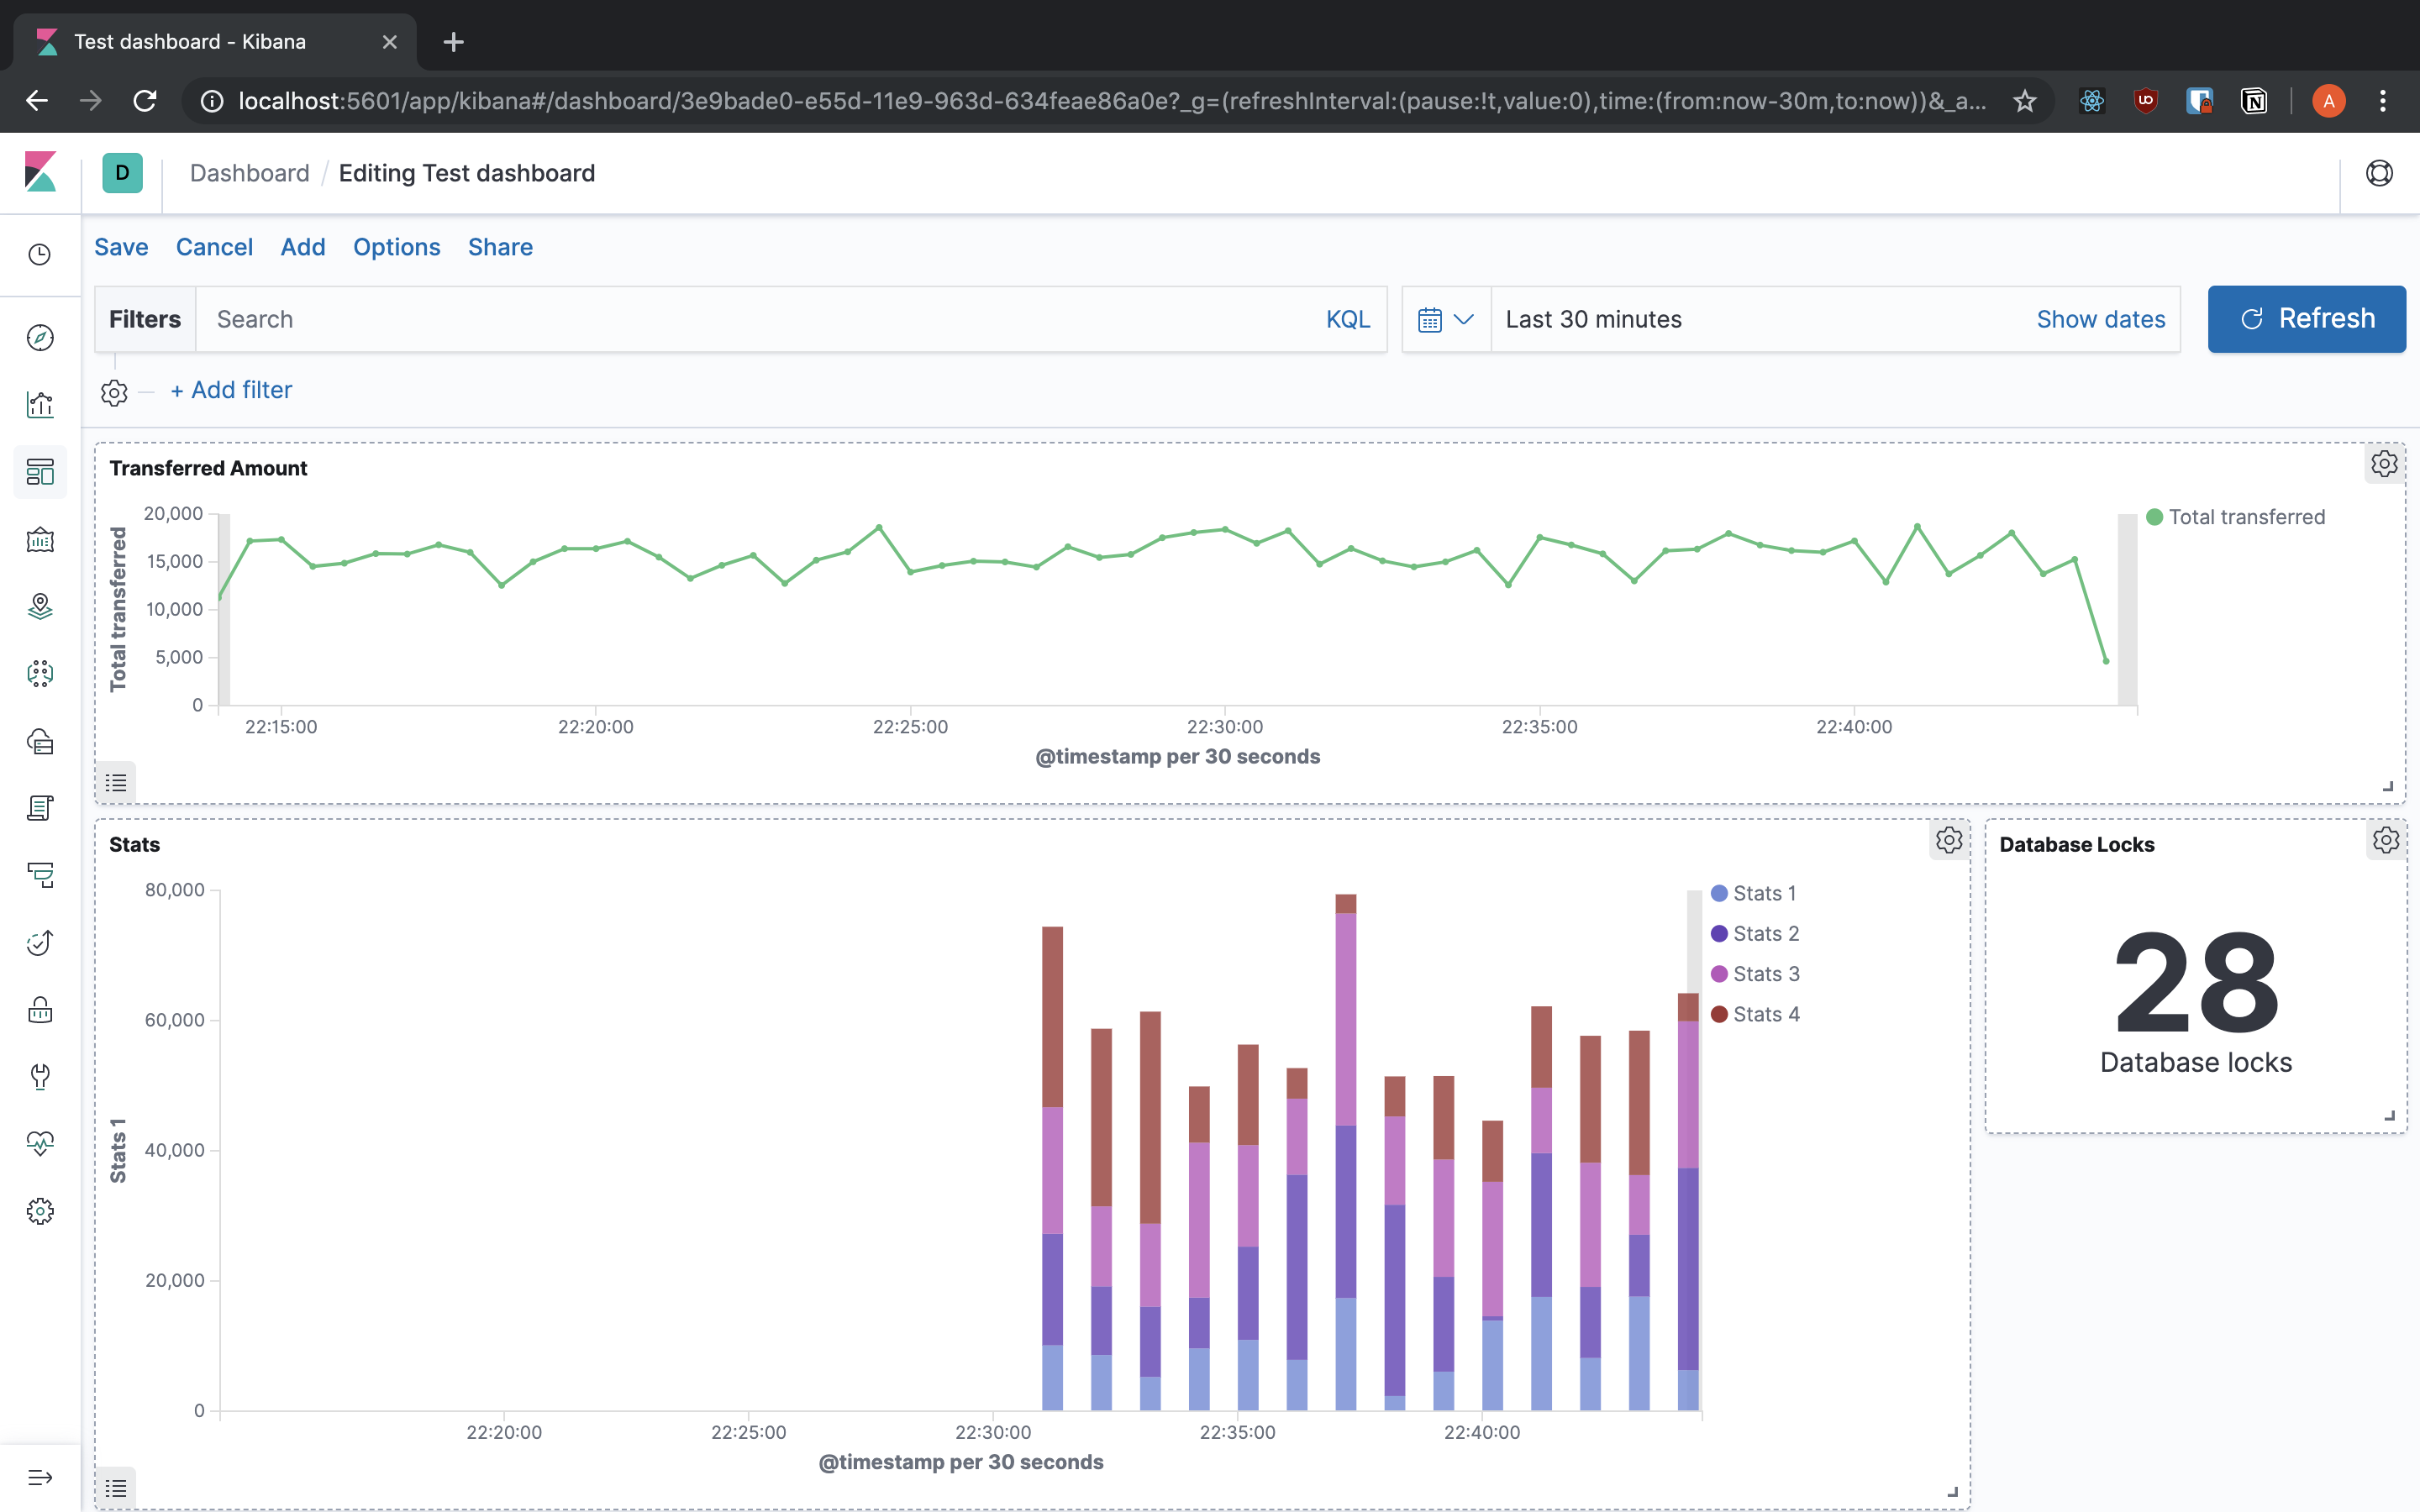
Dashboards
Now we can put together the visualisation that we built into Dashboards, so we can aggregate all the data that we want to see into one place. You can add the visualisations that you created and resize them to fit the screen the way you want. Also you can change the search for them and even have them in full screen to be displayed really nicely.
Dev Tools
Kibana also provides you with the Dev Tools sections that have some tools to help your work.
Console
We saw that Elasticsearch has a REST-like API, well the console provides an easy way to interact with the API. Providing auto-complete and connecting straight away to Elasticsearch so you don't have to build the entire request by hand. You can make a request just by having the method and the path, you can also write JSON with verification and completion.
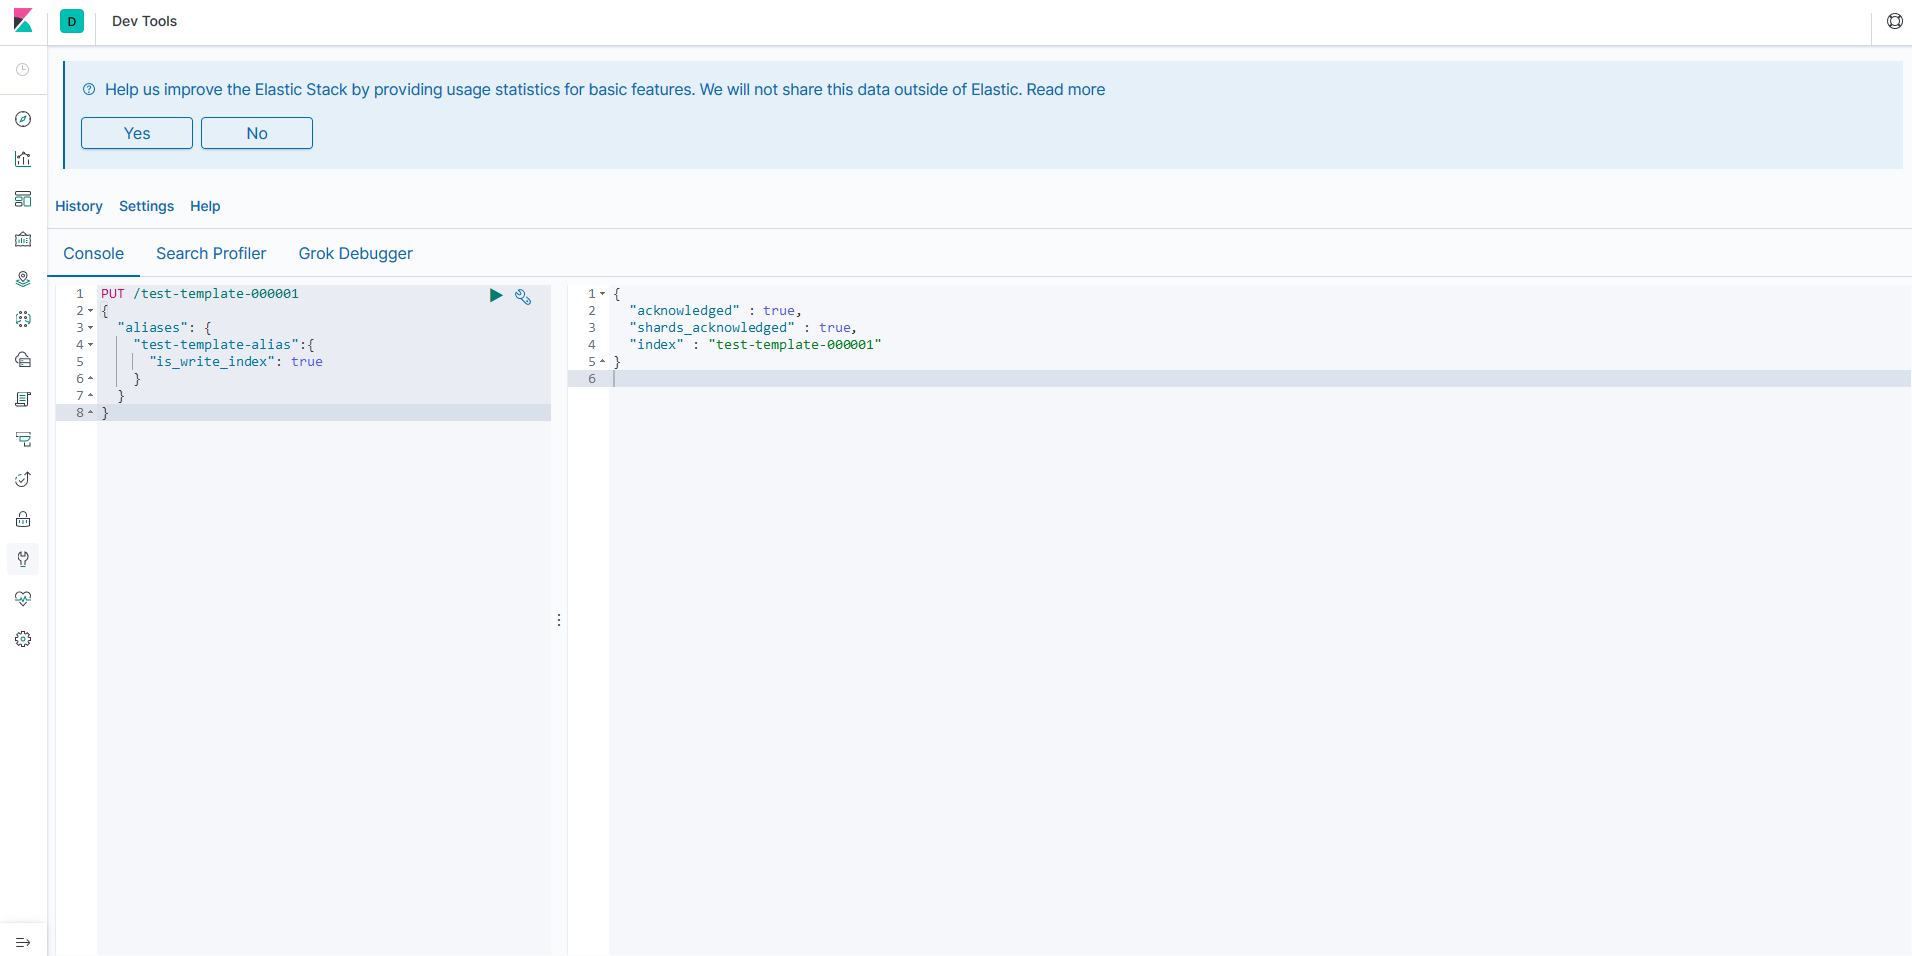
GET _template/transfers_template
PUT /test-template-000001
{
  "aliases": {
    "test-template-alias": {
      "is_write_index": true
    }
  }
}
Grok Debugger
When we were talking about Logstash we saw the Grok plugin and how powerful it can be, but Grok works using regexes, and everyone knows that regexes are complete madness and very easy to break, so the debugger helps us to build the patterns to parse our log lines.
We have the message getting the stats from our server, there are four columns, but we have to split into proper fields so we use the Grok parser for that.
16765 | 10475 | 26017 | 27583
%{NUMBER:stats1} \| %{NUMBER:stats2} \| %{NUMBER:stats3} \| %{NUMBER:stats4} 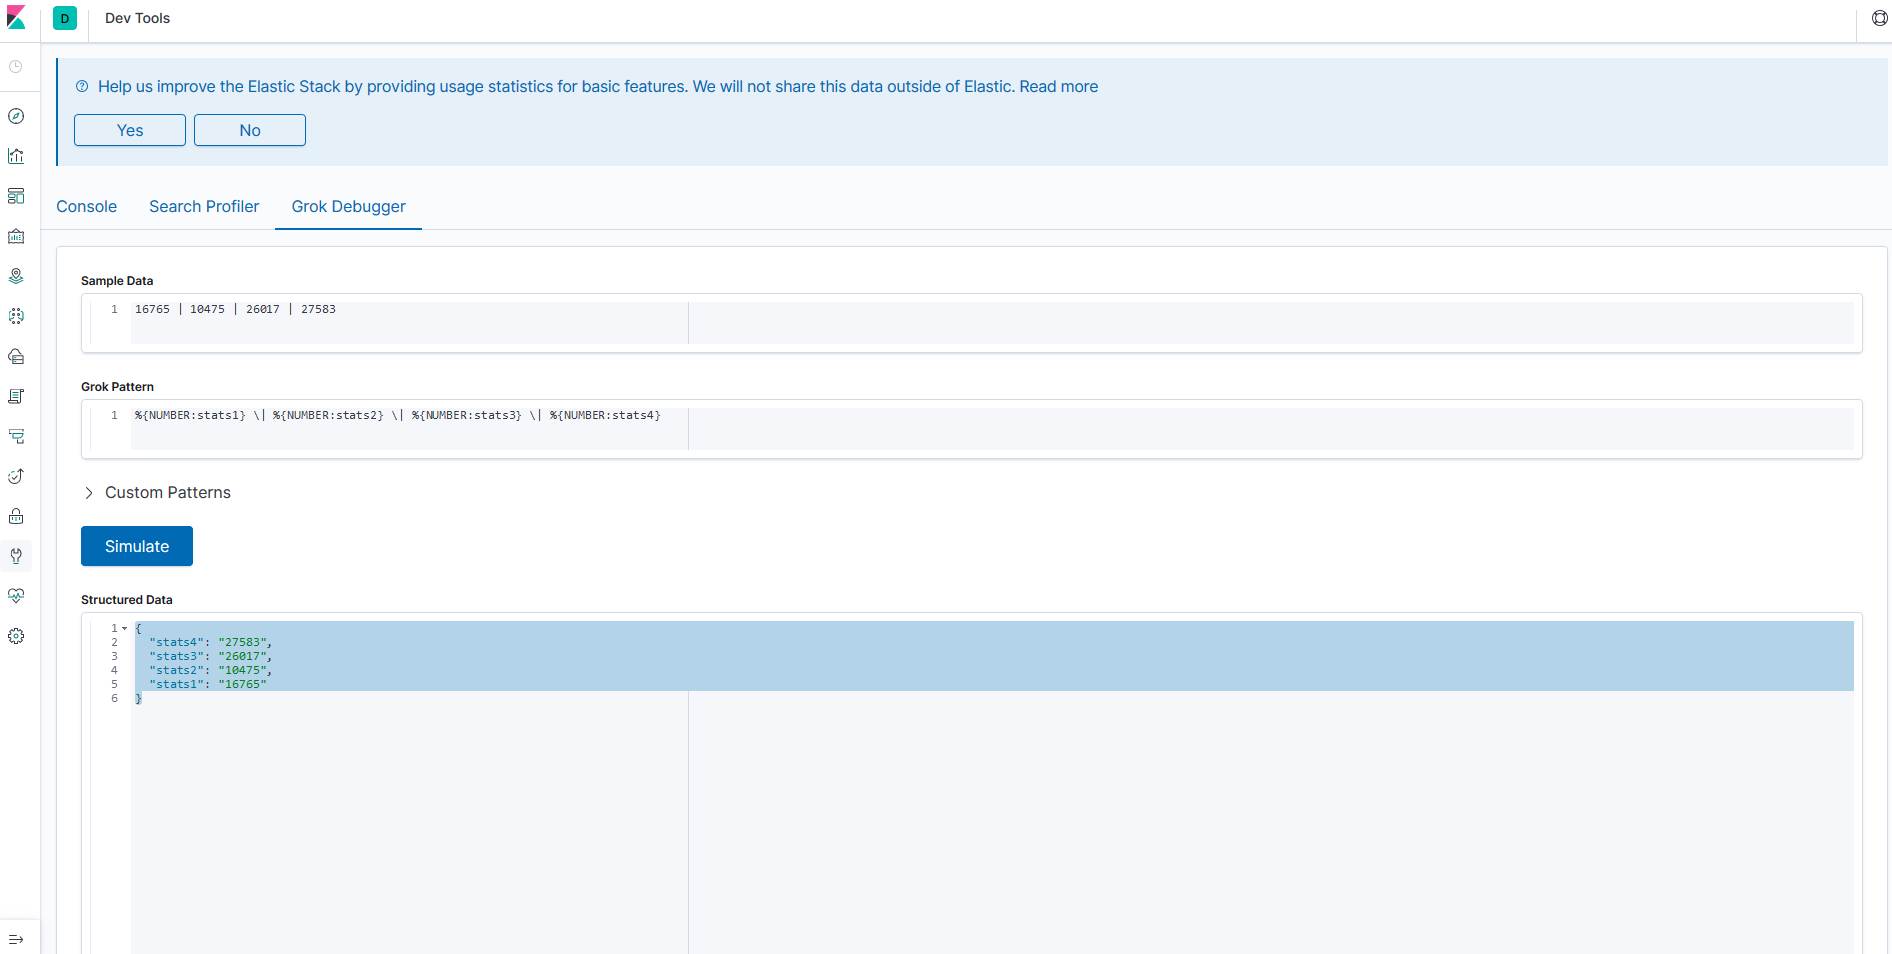
That's all for today
In this post we saw the components of the Elastic Stack, how to start using them and the importance of having your logs organised. Also you can always resort to the Elastic Stack documentation here to see what other functionality is supported that isn't mentioned in my post.